Installation
To download this package, click here
Python
This tool has been tested with Anaconda, python 3.6.8. To install this version of python, install Anaconda by following this link. Follow links for downloading the Python 3.7 version.
Pytorch
This tool has been tested with pytorch 0.4.1 Install this version of pytorch by running:
conda install pytorch=0.4.1 -c pytorch
Tifffile
This tool has been tested with tifffile 0.14.0 Install this version of tifffile by running:
conda install -c conda-forge tifffile
Running
To run this tool, first open the Terminal. Change into the directory containing this code
cd /path/to/centrosome-analysis
Then run centosome_analysis_gui.py
python centrosome_analysis_gui.py
Analysis can be performed through the following steps.
-
First, click on File->Load centrosome detector. Choose the centrosome detector file
foci_model.pt -
Second, click on File->Load cell model. Choose the cell segmentation file
cell_model.pt. These first two steps only need to be done once per session. -
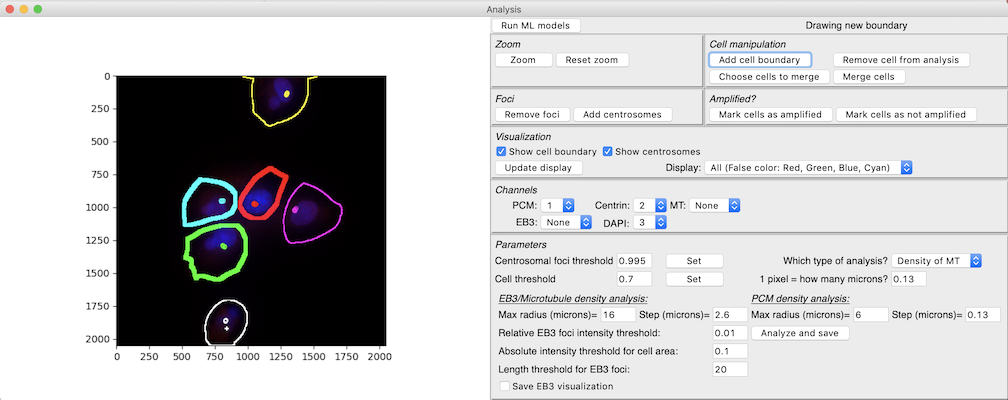
Then, to analyze an image, lick on File->Open Image and choose the image you want to analyze. The image will be displayed in false color, with the first channel represented as red, second as green, third as blue and fourth as cyan. The tool currently does not allow for more than 4 channels. Individual channels can be visualized by choosing different options in the
Displaydrop down menu in theVisualizationtoolbar. You can also zoom into particular regions of the image by clicking thezoombutton and then identifying a region by clicking aand dragging on the image. Click onReset zoomto return to the original resolution. -
Next, you will need to choose the channel which represents PCM, the channel which represents Centrin and the channel which represents DAPI in the
Channelstoolbar. PCM and Centrin channels are needed for centrosome detection. Cell segmentation additionally needs DAPI. -
Next, click on
Run ML modelsto run the centrosome detector and the cell segmentation. These models will be run on the image and the results displayed as an overlay on the image. The cell segmentation will be shown as colored boundaries, with the boundaries being thick if the model thinks the cell is centrosome-amplified (more than 4 centrosomes detected). Centrosomes will be depicted either as circles or with a+sign (the tool clusters the centrosomes and picks one cluster of centrosomes per cell for analysis. The cluster chosen is the one shown with circles). -
You can change the threshold for the centrosome detection and cell segmentation. Increasing the threshold for the centrosome detection leads to fewer detections. Increasing the threshold for the cell segmentation leads to more cells.
- You can also make corrections to the centrosome detections and cell boundaries.
- You can make two kinds of corrections to the centrosome detections:
- You can add new centrosomes by first clicking the
Add centrosomesbutton and then clicking to add centrosomes. - You can remove spurious foci by first clicking the
Remove centrosomesbutton and then clicking on the spurious centrosomes.
- You can add new centrosomes by first clicking the
- You can make three kinds of corrections to the cell segmentations
- You can add cell boundaries that were missed. To do so, click
Add cell boundaryand draw the boundary on the image. - You can merge cells that were wrongly separated. To do so, click
Choose cells to merge, click on the cells you want to merge and then clickMerge cells. - You can remove cells from analysis by clicking
Remove cell from analysisand then clickingRemove cell from analysis.
- You can add cell boundaries that were missed. To do so, click
- You can also change the labeling of cells as amplified or not by clicking
Mark cells as amplifiedandMark cells as not amplifiedand clicking on cells. - Once you have made corrections, you can save these corrections by clicking File->Save corrections.
- You can make two kinds of corrections to the centrosome detections:
- You can now make choices pertaining to the kind of analysis you want to make. Once you have decided the kind of analysis needed and the various parameters of this analysis, click on
Analyze and saveto finish the analysis and save the results. For the first image in a session, you will be prompted for the filename you want to save it to. The filename must be acsvfile. If the file exists, new results will be appended to the previous results.
Re-training
If you have saved enough corrections (e.g., at least 10 images), then the corrections can be used to re-train the centrosome detector. When you save corrections, these will be saved as json files. Create a csv file (comma-separated values, this can be done in Excel) with two columns and no headers. The first column should contain the full path to each image, and the second column should contain the full path to the corresponding corrected annotations. An example of such a csv is given in sample-retraining.csv
Once you have created such a csv (say training_files.csv), you can run the following command to retrain:
python train_foci_detector.py --trainfiles training_files.csv --modelfile foci_model_retrained.pt